| Return shipping will be paid by | Buyer |
|---|---|
| All returns accepted | Returns Accepted |
| Item must be returned within | 14 Days |
| Refund will be given as | Money Back |
| Sport | Baseball |
| League | Major League (MLB) |
| Year | 1997 |
| Vintage | Yes |
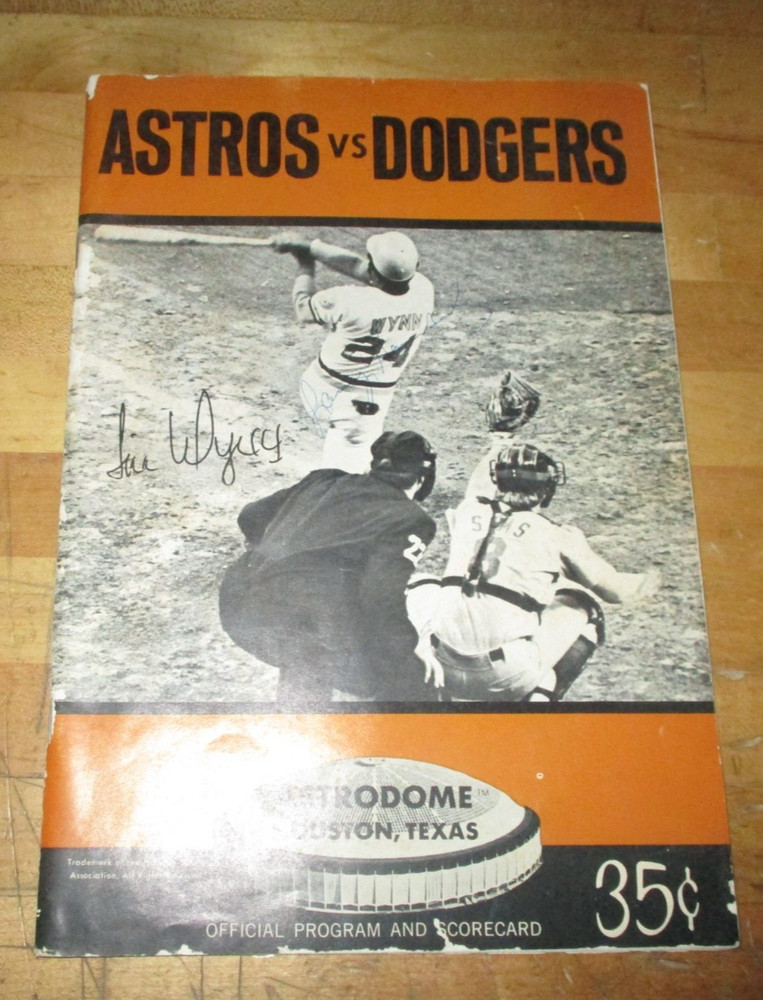
Check the listing for details. AUGUST 20, 1997 COLORADO ROCKIES @ CINCINNATI REDS FULL TICKET. Listed at 18.95 USD. AUGUST 20, 1997 COLORADO ROCKIES @ CINCINNATI REDS FULL TICKET VINNY CASTILLO HOMERUNELLIS BURKS HOMERUNColorado Rockies Share & ExportModify, Export & Share TableGet as Excel WorkbookGet table as CSV (for Excel)Get Link to TableAbout Sharing ToolsVideo: SR Sharing Tools & How-toVideo: Stats Table Tips & TricksData Usage TermsGlossaryPlayer Name Bold can mean player is active for this team or player has appeared in the majors * means LHP or LHB, # means switch hitter, + can mean HOFer.">BattingABRHRBIBBSOPlate Appearances When available, we use actual plate appearances from play-by-play game accounts Otherwise estimated using AB + BB + HBP + SF + SH, which excludes catcher interferences. When this color click for a summary of each PA.">PAHits/At Bats For recent years, leaders need 3.1 PA per team game played Bold indicates highest BA using current stats Gold means awarded title at end of year." data-filter="1" data-name="Batting Average">BA(H + BB + HBP)/(At Bats + BB + HBP + SF) For recent years, leaders need 3.1 PA per team game played" data-filter="1" data-name="On-Base%">OBPTotal Bases/At Bats or (1B + 2*2B + 3*3B + 4*HR)/AB For recent years, leaders need 3.1 PA per team game played" data-filter="1" data-name="Slugging %">SLGOn-Base + Slugging Percentages For recent years, leaders need 3.1 PA per team game played" data-filter="1" data-name="On-Base Plus Slugging">OPSPitStrikes Includes both pitches in the zone and those swung at out of the zone.">StrWin Probability Added for Offensive Player Given average teams, this is the change in probability caused by this batter during the game A change of +/- 1 would indicate one win added or lost." data-filter="1" data-name="Win Probability Added (WPA)">WPAAverage Leverage Index The average pressure the pitcher or batter saw in this game or season. 1.0 is average pressure, below 1.0 is low pressure and above 1.0 is high pressure." data-filter="1" data-name="aLI">aLIWin Probability Added Sum of positive events for this batter." data-filter="1" data-name="WPA+">WPA+Win Probability Subtracted Sum of negative events for this batter." data-filter="1" data-name="WPA-">WPA-Championship Win Probability Added for Offensive Player Given average teams, this is the change in probability, displayed in percentage points. A change of +/- 100% would indicate one world series win added or lost." data-filter="1" data-name="Championship WPA (cWPA)">cWPAAverage Championship Leverage Index The average pressure the pitcher or batter saw in this game or season. 1.0 is average pressure, below 1.0 is low pressure and above 1.0 is high pressure." data-filter="1" data-name="acLI">acLIBase-Out Runs Added Given the bases occupied/out situation, how many runs did the batter or baserunner add in the resulting play. Compared to average, so 0 is average, and above 0 is better than average" data-filter="1" data-name="Base-Out Runs Added (RE24)">RE24POADetailsNeifi Pérez 2B5110015.302.356.500.8561613-0.0510.590.017-0.068-0.00%0.05-1.0142BEllis Burks CF-LF4212115.266.345.556.90132200.1070.690.155-0.0480.01%0.051.420HRLarry Walker RF3000215.373.462.7091.1702212-0.0480.550.012-0.059-0.00%0.04-0.241Andrés Galarraga 1B3010105.317.391.572.96316100.0160.590.046-0.0300.00%0.040.270HBPDante Bichette LF4021004.307.343.493.8361280.1000.910.141-0.0410.01%0.071.2202B Quinton McCracken PR-CF1100001.278.364.352.71622-0.0040.510.011-0.0150%0.04-0.200SBVinny Castilla 3B4121125.298.350.548.89822120.1350.720.164-0.0290.01%0.060.810HRKirt Manwaring C4011024.241.315.302.6171312-0.0790.950.020-0.100-0.00%0.07-0.580Walt Weiss SS4000024.268.358.377.7351411-0.0740.730.000-0.074-0.00%0.06-1.122Frank Castillo P3000033.143.143.143.2861210-0.0540.670.000-0.054-0.00%0.05-0.600 Todd Helton PH1010001.316.395.500.895650.0030.080.0030.0000%0.010.2 Darren Holmes P0000000.167.167.333.50000 Jerry Dipoto P0000000.125.125.125.25000Team Totals3659551242.250.357.472.8291671150.0510.680.569-0.5180.00%0.050.32772B: Neifi Pérez (9, off Scott Sullivan); Dante Bichette (24, off Félix Rodríguez).HR: Vinny Castilla (32, off Gabe White, 2nd inn, 0 on, 2 outs to Deep LF-CF); Ellis Burks (23, off Scott Sullivan, 7th inn, 1 on, 2 outs to Deep LF).HBP: Andrés Galarraga (13, by Jeff Tabaka).TB: Vinny Castilla 5; Ellis Burks 4; Dante Bichette 3; Neifi Pérez 2; Andrés Galarraga; Todd Helton; Kirt Manwaring.RBI: Ellis Burks 2 (60); Dante Bichette (92); Vinny Castilla (85); Kirt Manwaring (23).2-out RBI: Ellis Burks 2; Vinny Castilla; Dante Bichette.Team LOB: 10.With RISP: 3 for 8.FieldingDP: 2. Neifi Pérez-Walt Weiss-Andrés Galarraga; Larry Walker-Andrés Galarraga.Outfield Assists: Larry Walker (Brook Fordyce at 1st base).BaserunningSB: Quinton McCracken (26, 3rd base off Félix Rodríguez/Brook Fordyce).Cincinnati Reds Share & ExportModify, Export & Share TableGet as Excel WorkbookGet table as CSV (for Excel)Get Link to TableAbout Sharing ToolsVideo: SR Sharing Tools & How-toVideo: Stats Table Tips & TricksData Usage TermsGlossaryPlayer Name Bold can mean player is active for this team or player has appeared in the majors * means LHP or LHB, # means switch hitter, + can mean HOFer.">BattingABRHRBIBBSOPlate Appearances When available, we use actual plate appearances from play-by-play game accounts Otherwise estimated using AB + BB + HBP + SF + SH, which excludes catcher interferences. When this color click for a summary of each PA.">PAHits/At Bats For recent years, leaders need 3.1 PA per team game played Bold indicates highest BA using current stats Gold means awarded title at end of year." data-filter="1" data-name="Batting Average">BA(H + BB + HBP)/(At Bats + BB + HBP + SF) For recent years, leaders need 3.1 PA per team game played" data-filter="1" data-name="On-Base%">OBPTotal Bases/At Bats or (1B + 2*2B + 3*3B + 4*HR)/AB For recent years, leaders need 3.1 PA per team game played" data-filter="1" data-name="Slugging %">SLGOn-Base + Slugging Percentages For recent years, leaders need 3.1 PA per team game played" data-filter="1" data-name="On-Base Plus Slugging">OPSPitStrikes Includes both pitches in the zone and those swung at out of the zone.">StrWin Probability Added for Offensive Player Given average teams, this is the change in probability caused by this batter during the game A change of +/- 1 would indicate one win added or lost." data-filter="1" data-name="Win Probability Added (WPA)">WPAAverage Leverage Index The average pressure the pitcher or batter saw in this game or season. 1.0 is average pressure, below 1.0 is low pressure and above 1.0 is high pressure." data-filter="1" data-name="aLI">aLIWin Probability Added Sum of positive events for this batter." data-filter="1" data-name="WPA+">WPA+Win Probability Subtracted Sum of negative events for this batter." data-filter="1" data-name="WPA-">WPA-Championship Win Probability Added for Offensive Player Given average teams, this is the change in probability, displayed in percentage points. A change of +/- 100% would indicate one world series win added or lost." data-filter="1" data-name="Championship WPA (cWPA)">cWPAAverage Championship Leverage Index The average pressure the pitcher or batter saw in this game or season. 1.0 is average pressure, below 1.0 is low pressure and above 1.0 is high pressure." data-filter="1" data-name="acLI">acLIBase-Out Runs Added Given the bases occupied/out situation, how many runs did the batter or baserunner add in the resulting play. Compared to average, so 0 is average, and above 0 is better than average" data-filter="1" data-name="Base-Out Runs Added (RE24)">RE24POADetailsPokey Reese SS4120004.227.290.277.5671712-0.0031.050.064-0.0670%0.070.310SBJon Nunnally CF4012014.243.313.456.7691511-0.0511.350.093-0.144-0.00%0.100.8303BChris Stynes 2B4000004.444.457.6001.057147-0.1281.200.000-0.128-0.01%0.08-1.130 Stan Belinda P0000000.000.000.000.00000Eduardo Pérez 1B3111114.273.351.522.8731880.0901.050.141-0.0510.00%0.070.920HRReggie Sanders RF4000024.239.328.532.8592112-0.2531.650.000-0.253-0.01%0.11-1.520GDPWillie Greene 3B3000104.253.354.458.812159-0.0060.670.038-0.0440%0.05-0.110Mike Kelly LF3000013.263.309.491.800149-0.0720.960.000-0.072-0.00%0.06-0.720Ed Taubensee C2000012.250.308.450.7581310-0.0631.170.000-0.063-0.00%0.08-0.590 Scott Sullivan P0000000.000.000.000.00000 Félix Rodríguez P0000000.000.000.000.00000 Lenny Harris PH1000001.244.275.347.62222-0.0090.370.000-0.0090%0.03-0.2 Jeff Tabaka P000000000 Bret Boone 2B0000000.224.302.328.63000Gabe White P1000011.000.000.000.00033-0.0200.770.000-0.020-0.00%0.05-0.200 Brook Fordyce C1110102.214.282.300.582840.0660.810.0660.0000.00%0.060.540Team Totals303533733.167.242.333.57614087-0.4491.080.402-0.851-0.02%0.07-1.72703B: Jon Nunnally (2, off Darren Holmes).HR: Eduardo Pérez (13, off Frank Castillo, 7th inn, 0 on, 1 out to Deep LF).TB: Eduardo Pérez 4; Jon Nunnally 3; Pokey Reese 2; Brook Fordyce.GIDP: Reggie Sanders (6).RBI: Jon Nunnally 2 (14); Eduardo Pérez (40).2-out RBI: Jon Nunnally 2.Team LOB: 3.With RISP: 1 for 4.BaserunningSB: Pokey Reese (23, 2nd base off Frank Castillo/Kirt Manwaring). Colorado Rockies Share & ExportModify, Export & Share TableGet as Excel WorkbookGet table as CSV (for Excel)Get Link to TableAbout Sharing ToolsVideo: SR Sharing Tools & How-toVideo: Stats Table Tips & TricksData Usage TermsGlossaryPlayer Name Bold can mean player is active for this team or player has appeared in the majors * means LHP or LHB, # means switch hitter, + can mean HOFer.">PitchingIPHRERBBSOHR9 * ER / IP For recent years, leaders need 1 IP per team game played. Bold indicates lowest ERA using current stats Gold means awarded ERA title at end of year." data-filter="1" data-name="Earned Run Average">ERABFPitStrikes Includes both pitches in the zone and those swung at out of the zone.">StrStrikes by Contact Strikes from foul balls or balls put into play.">CtctStrikes Swinging Strikes due to a swing and a miss.">StSStrikes Looking Strikes called by the umpire.">StLGround Balls Includes bunts and all other ground balls.">GBFly Balls Includes Fly Balls, Line Drives, and Pop-Ups.">FBLine Drives These are double-counted in Fly Balls as well.">LDUnknown batted ball type A ball in play for which we don’t know the type.">UnkGame Score Developed by Bill James 1. Start with 50 points. 2. Add 1 point for each out recorded, so 3 points for every complete inning pitched. 3. Add 2 points for each inning completed after the 4th. 4. Add 1 point for each strikeout. 5. Subtract 2 points for each hit allowed. 6. Subtract 4 points for each earned run allowed. 7. Subtract 2 points for each unearned run allowed. 8. Subtract 1 point for each walk. ">GScInherited Runners Number of runners on base when pitcher entered the game.">IRInherited Score Number or percentage of runners on base when pitcher entered the game who subsequently scored. These runners show up in the previous pitcher’s ERA.">ISWin Probability Added by Pitcher Given average teams, this is the change in probability A change of +/- 1 would indicate one win added or lost." data-filter="1" data-name="Win Probability Added (WPA)">WPAAverage Leverage Index The average pressure the pitcher or batter saw in this game or season. 1.0 is average pressure, below 1.0 is low pressure and above 1.0 is high pressure." data-filter="1" data-name="aLI">aLIChampionship Win Probability Added by Pitcher Given average teams, this is the change in probability, displayed in percentage points. A change of +/- 100% would indicate one world series win added or lost." data-filter="1" data-name="Championship WPA (cWPA)">cWPAAverage Championship Leverage Index The average pressure the pitcher or batter saw in this game or season. 1.0 is average pressure, below 1.0 is low pressure and above 1.0 is high pressure." data-filter="1" data-name="acLI">acLIBase-Out Runs Saved Given the bases occupied/out situation, how many runs did the pitcher save in the resulting play. Compared to average, so 0 is average, and above 0 is better than average" data-filter="1" data-name="Base-Out Runs Saved (RE24)">RE24Frank Castillo, W (10-10)73111615.26241026936171651220720.3831.050.02%0.082.7Darren Holmes12221105.2362413733221000-0.0320.77-0.00%0.06-1.5Jerry Dipoto, S (9)10001004.5631452122000000.0962.000.00%0.150.5Team Totals95333713.0033140874521219143072000.4471.080.02%0.081.7Cincinnati Reds Share & ExportModify, Export & Share TableGet as Excel WorkbookGet table as CSV (for Excel)Get Link to TableAbout Sharing ToolsVideo: SR Sharing Tools & How-toVideo: Stats Table Tips & TricksData Usage TermsGlossaryPlayer Name Bold can mean player is active for this team or player has appeared in the majors * means LHP or LHB, # means switch hitter, + can mean HOFer.">PitchingIPHRERBBSOHR9 * ER / IP For recent years, leaders need 1 IP per team game played. Bold indicates lowest ERA using current stats Gold means awarded ERA title at end of year." data-filter="1" data-name="Earned Run Average">ERABFPitStrikes Includes both pitches in the zone and those swung at out of the zone.">StrStrikes by Contact Strikes from foul balls or balls put into play.">CtctStrikes Swinging Strikes due to a swing and a miss.">StSStrikes Looking Strikes called by the umpire.">StLGround Balls Includes bunts and all other ground balls.">GBFly Balls Includes Fly Balls, Line Drives, and Pop-Ups.">FBLine Drives These are double-counted in Fly Balls as well.">LDUnknown batted ball type A ball in play for which we don’t know the type.">UnkGame Score Developed by Bill James 1. Start with 50 points. 2. Add 1 point for each out recorded, so 3 points for every complete inning pitched. 3. Add 2 points for each inning completed after the 4th. 4. Add 1 point for each strikeout. 5. Subtract 2 points for each hit allowed. 6. Subtract 4 points for each earned run allowed. 7. Subtract 2 points for each unearned run allowed. 8. Subtract 1 point for each walk. ">GScInherited Runners Number of runners on base when pitcher entered the game.">IRInherited Score Number or percentage of runners on base when pitcher entered the game who subsequently scored. These runners show up in the previous pitcher’s ERA.">ISWin Probability Added by Pitcher Given average teams, this is the change in probability A change of +/- 1 would indicate one win added or lost." data-filter="1" data-name="Win Probability Added (WPA)">WPAAverage Leverage Index The average pressure the pitcher or batter saw in this game or season. 1.0 is average pressure, below 1.0 is low pressure and above 1.0 is high pressure." data-filter="1" data-name="aLI">aLIChampionship Win Probability Added by Pitcher Given average teams, this is the change in probability, displayed in percentage points. A change of +/- 100% would indicate one world series win added or lost." data-filter="1" data-name="Championship WPA (cWPA)">cWPAAverage Championship Leverage Index The average pressure the pitcher or batter saw in this game or season. 1.0 is average pressure, below 1.0 is low pressure and above 1.0 is high pressure." data-filter="1" data-name="acLI">acLIBase-Out Runs Saved Given the bases occupied/out situation, how many runs did the pitcher save in the resulting play. Compared to average, so 0 is average, and above 0 is better than average" data-filter="1" data-name="Base-Out Runs Saved (RE24)">RE24Gabe White, L (1-1)5.23222813.2022815830161211110610.1580.800.01%0.061.7Scott Sullivan1.13222112.47938221354240021-0.2020.88-0.01%0.06-2.0Félix Rodríguez13110205.52624191153221000-0.0270.29-0.00%0.02-0.5Jeff Tabaka0.10001000.0031811722010000-0.0120.33-0.00%0.02-0.4Stan Belinda0.20000103.452651310100200.0300.620.00%0.040.9Team Totals995551225.0042167115623122519206141-0.0530.68-0.00%0.05-0.3Balks: None.WP: Félix Rodríguez (3).HBP: Jeff Tabaka (1; Andrés Galarraga).IBB: None.Pickoffs: None.Other Info Umpires: HP - Gary Darling, 1B - Charlie Reliford, 2B - Jim Quick, 3B - Dana DeMuth.Time of Game: 2:59.Attendance: 21,968.Field Condition: Wet.Start Time Weather: 67° F, Wind 3mph out to Centerfield, Cloudy, No Precipitation.SCANS: normal wear and tear, SHIPPED WITH IN TWO BUSINESS DAYS AFTER PAYMENT HAS BEEN RECEIVED.
You may also like